LLM Inference Internals: KV Cache, Flash Attention, and Optimizing for Apple Silicon
Introduction
This is a companion post to my Claude Code + Ollama troubleshooting guide, where I debugged why a local LLM session took 1 hour instead of 9 minutes. That post covers the practical diagnosis and fixes. This one gets into the inference internals that explain why local LLM inference behaves the way it does.
If you work with local LLMs (whether through Ollama, llama.cpp, MLX, or any other engine), understanding these internals will help you reason about performance, tune parameters effectively, and avoid pitfalls that waste memory and time.
The reference model throughout this post is qwen3-coder-next:q4_K_M (79.7B parameters, Q4_K_M quantization, 48 layers) running on a Mac Mini M4 Pro with 64GB unified memory.
Credits: Generated using NotebookLM
The Two Phases of LLM Inference
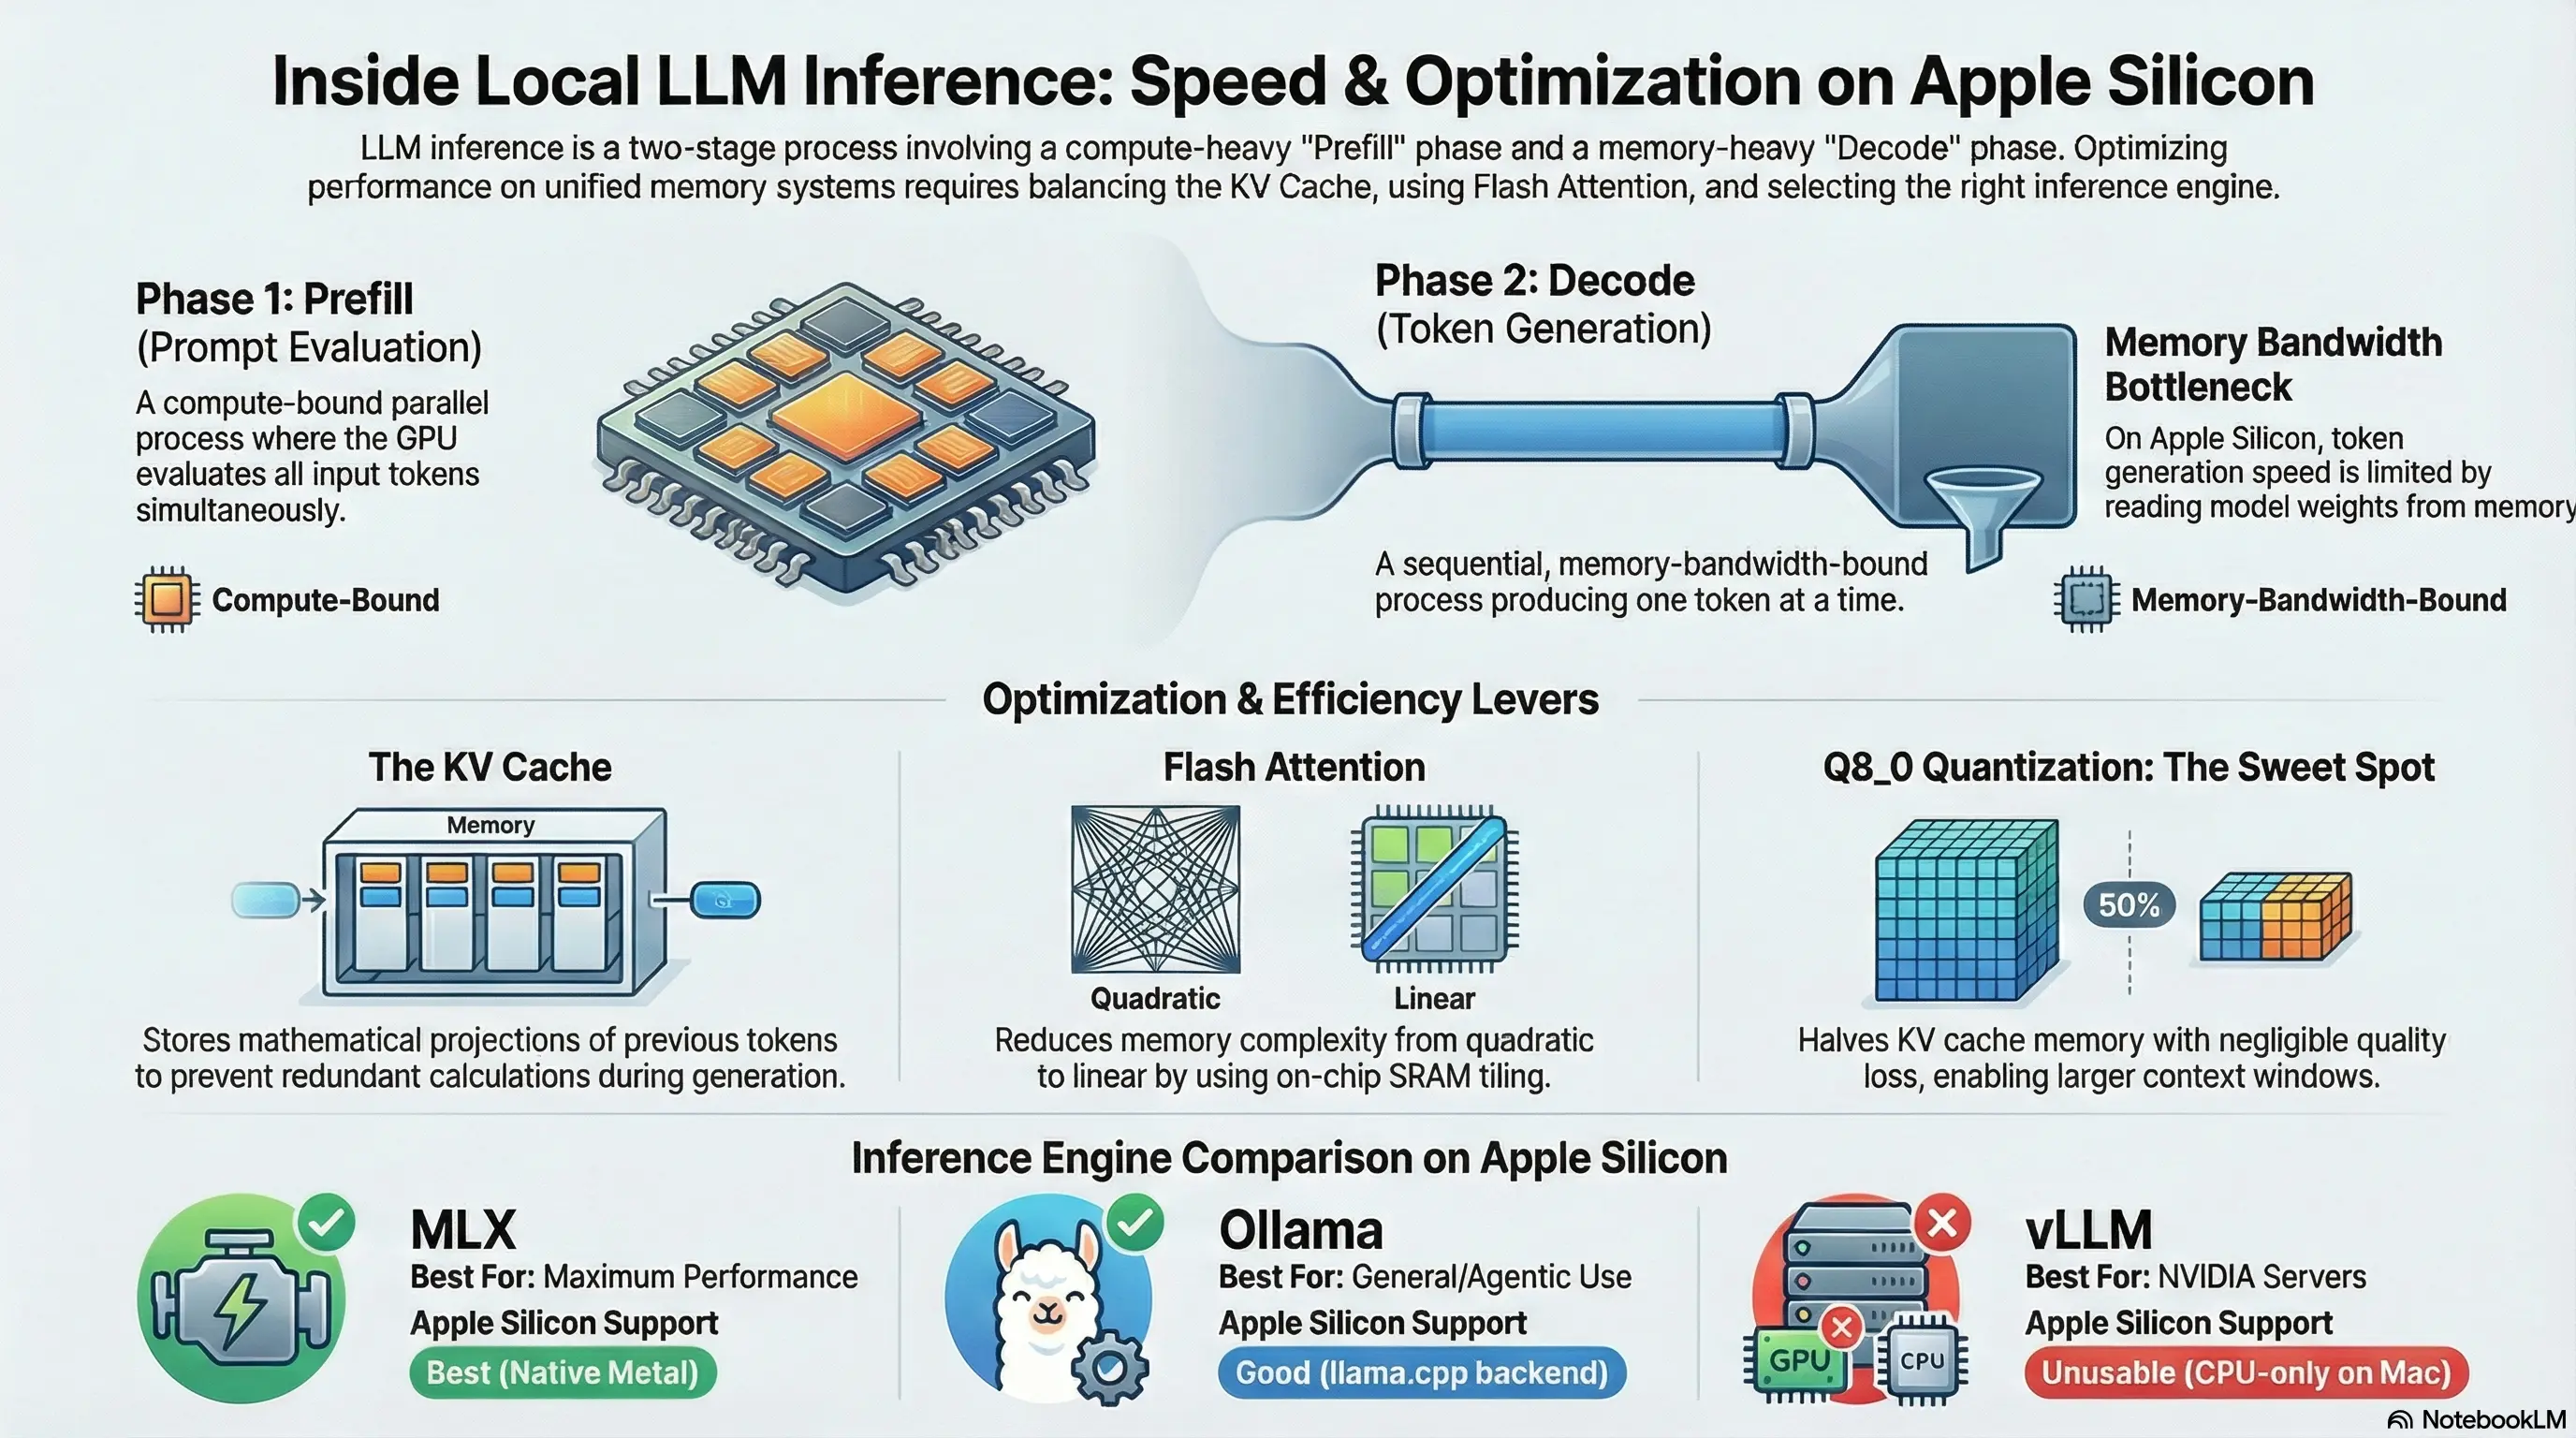
Every time you send a prompt to an LLM and get a response, two distinct computational phases occur.
Phase 1: Prefill (Prompt Evaluation)
During prefill, the model processes all input tokens (your system prompt, conversation history, tool definitions, and the new user message) in parallel via batched matrix multiplications.
Key characteristics:
- Compute-bound: The bottleneck is raw computation, not memory bandwidth
- Parallel: All input tokens are processed simultaneously (within batch limits)
- Scales with:
batch_size × seq_len × hidden_dim - Measured in: tokens/second of input processed
For our qwen3-coder-next model, prompt evaluation runs at ~20 tokens/second. That means evaluating a 16K token prompt takes approximately 800 seconds (~13 minutes) without KV cache reuse.
Why is it faster per-token than decode? Because the GPU can parallelize the matrix multiplications across all input tokens simultaneously. But “faster per-token” doesn’t mean “fast”. When you have 16,000+ tokens of input, the absolute time is still significant.
Phase 2: Decode (Token Generation)
During decode, the model generates output one token at a time. Each new token is produced autoregressively. It depends on every token that came before it, so there’s no way to parallelize the generation itself.
Key characteristics:
- Memory-bandwidth-bound: The bottleneck is reading the KV cache and model weights from memory for each token
- Sequential: Strictly one token at a time
- Scales with: model size + KV cache size (memory reads per token)
- Measured in: tokens/second of output generated
For our model, decode runs at ~23 tokens/second. The limiting factor is reading ~54 GB of model weights from unified memory for each token, plus the KV cache. Apple Silicon’s unified memory bandwidth (M4 Pro: ~273 GB/s) determines this ceiling.
The key insight: In an agentic workflow like Claude Code with 57 API round-trips, most time is spent in prefill, not decode. Decode only happens once per round-trip (for the response), but prefill happens every time with the full conversation context.
How the KV Cache Works
The KV cache is the single most important concept for understanding local LLM performance.
What It Stores
During the attention computation in each transformer layer, the model computes three projections of the input: Query (Q), Key (K), and Value (V). The Q projection is used immediately, but K and V are stored in the KV cache for future reference.
Each layer independently maintains its own K and V tensors. The KV cache stores, for every token in the current sequence, the Key and Value vectors for every layer and every attention head.
Why It Exists
Without the KV cache, generating token N+1 would require recomputing the attention over all N previous tokens from scratch, re-running the full model forward pass for the entire sequence. With the KV cache, the model only needs to:
- Compute Q, K, V for the new token
- Append the new K, V to the cache
- Compute attention between the new Q and all cached K, V entries
This turns an O(n²) per-token decode cost into O(n), at the expense of memory.
Memory Formula
KV Cache Memory = 2 × num_layers × num_kv_heads × head_dim × seq_len × dtype_bytes
Where:
2: one for Keys, one for Valuesnum_layers: number of transformer layers (48 for qwen3-coder-next)num_kv_heads: number of key/value attention heads (may differ from query heads in GQA models)head_dim: dimension per attention head (typicallyhidden_dim / num_heads)seq_len: current sequence length (up tonum_ctx)dtype_bytes: bytes per element (2 for fp16, 1 for q8_0, 0.5 for q4_0)
Worked Example: qwen3-coder-next
The model has these attention parameters:
- Layers: 48
- Attention heads: 16
- Embedding dimension: 2048
- Head dimension: 2048 / 16 = 128
At 16K context (num_ctx = 16,384) with fp16:
KV Cache = 2 × 48 × 16 × 128 × 16,384 × 2 bytes
         = 2 × 48 × 16 × 128 × 16,384 × 2
         = 6,442,450,944 bytes
         ≈ 6.0 GB
At 32K context (num_ctx = 32,768) with fp16:
KV Cache = 2 × 48 × 16 × 128 × 32,768 × 2 bytes
         ≈ 12.0 GB
Doubling the context length doubles the KV cache memory. With a 54 GB model in a 64 GB system, 6 GB for the KV cache at 16K context is tight but feasible. 12 GB at 32K would push total memory usage to 66 GB, exceeding physical RAM and triggering swap.
KV Cache Quantization
This is where OLLAMA_KV_CACHE_TYPE comes in. Instead of storing K and V in fp16 (2 bytes per element), you can quantize them:
q8_0 (8-bit quantization):
- 1 byte per element instead of 2
- ~50% memory reduction
- Minimal quality loss in practice
- 16K context: ~3.0 GB instead of 6.0 GB
- 32K context: ~6.0 GB instead of 12.0 GB, now fits comfortably alongside the 54 GB model
q4_0 (4-bit quantization):
- 0.5 bytes per element
- ~75% memory reduction
- More quality risk; attention patterns may degrade on long sequences
- 16K context: ~1.5 GB
- 32K context: ~3.0 GB
For a 64 GB system with a 54 GB model, q8_0 is the sweet spot. It halves KV cache memory with negligible quality impact, giving you headroom to increase context length.
KV Cache Reuse in Ollama
Ollama implements an important optimization: prompt prefix caching. If a new request shares the same prefix as the previous request (which is the normal case in a multi-turn conversation, since the history stays the same and you just append a new user message), Ollama reuses the KV cache entries for the shared prefix and only evaluates the new tokens at the end.
This is why the second API call in my debug trace took only 6 seconds instead of 77: the KV cache from the first call was still warm, and only the new ~200 tokens needed evaluation.
For this to work:
- The model must stay loaded in memory (set
OLLAMA_KEEP_ALIVE=60m) - The context must not have been evicted (happens if context exceeds
num_ctx) - The prompt prefix must be byte-identical to the previous request
Attention and Flash Attention
Standard (Vanilla) Attention
The core attention computation is:
Attention(Q, K, V) = softmax(Q × K^T / √d_k) × V
Where:
Q= Query matrix (seq_len × head_dim)K= Key matrix (seq_len × head_dim)V= Value matrix (seq_len × head_dim)d_k= head dimension (for scaling)
The expensive step is Q × K^T, which produces the attention score matrix of shape (seq_len × seq_len). This is the O(n²) bottleneck.
Memory cost for the attention matrix alone:
For a 32K context with fp16:
32,768 × 32,768 × 2 bytes = 2,147,483,648 bytes ≈ 2.0 GB
That’s 2 GB per attention head, per layer. With 16 heads and 48 layers, the total attention memory would be astronomical. In practice, implementations process one head at a time, but the O(n²) memory for a single head’s attention matrix is still the constraint.
Flash Attention: Tiled Computation
Flash Attention, introduced by Dao et al. (2022), changes how attention is computed by never materializing the full n×n attention matrix.
Key ideas:
Tiling: Instead of computing the full attention matrix, Flash Attention breaks Q, K, V into blocks that fit in fast on-chip SRAM (shared memory / register file)
Online softmax: Uses an online algorithm to compute the softmax incrementally across tiles, without needing the full row of attention scores
IO-awareness: Minimizes data movement between slow main memory (unified memory / HBM) and fast SRAM. The standard attention algorithm reads/writes the full n×n matrix to main memory; Flash Attention keeps intermediate values in SRAM
Memory complexity: O(n) instead of O(n²). Only needs to store Q, K, V and the output, never the full attention matrix
Speed improvement: Counterintuitively, Flash Attention is also faster despite doing the same mathematical computation. By reducing memory I/O (which is the actual bottleneck on modern hardware), it achieves higher throughput.
On Apple Silicon: Flash Attention is implemented via Metal compute shaders. Apple Silicon’s unified memory architecture (where CPU and GPU share the same physical memory) makes Flash Attention especially effective because there’s no PCIe transfer overhead. The GPU compute units can directly access model weights and KV cache in unified memory, and Flash Attention ensures the attention computation stays in fast on-chip memory.
Enable it in Ollama with: OLLAMA_FLASH_ATTENTION=1
Context Length and Its Cost
The num_ctx parameter in Ollama controls how many tokens the model can consider in a single request. It has two direct costs:
Linear Cost: KV Cache Memory
As shown in the KV cache calculation above, doubling context length doubles KV cache memory. This is a linear relationship, straightforward and predictable.
Quadratic Cost: Attention (Without Flash Attention)
Without Flash Attention, attention computation scales with O(n²) in both memory and compute. Going from 16K to 32K context quadruples the attention matrix size. Flash Attention reduces the memory cost to O(n), but the compute cost of attention is still O(n² × d), since every query must attend to every key. What Flash Attention eliminates is the memory materialization, not the mathematical operations.
The num_ctx Pre-allocation
When Ollama loads a model with a given num_ctx, it pre-allocates the full KV cache for that many tokens upfront. Even if your prompt is only 1,000 tokens, the memory for 16,384 tokens (or whatever num_ctx is set to) is already reserved.
This means increasing num_ctx has an immediate memory cost at model load time, not just when the context is actually filled. Plan your num_ctx based on available memory:
Available for KV cache = Total RAM - Model size - OS overhead
For our setup:
64 GB - 54 GB (model) - 4 GB (OS/apps) = ~6 GB available
With q8_0 KV cache: 6 GB supports ~32K context. With fp16 KV cache: 6 GB supports ~16K context.
Batch Size (num_batch) and Prompt Eval Speed
The num_batch parameter controls how many tokens are processed in a single forward pass during prefill. This directly affects prompt evaluation speed.
How It Works
During prefill, if you have 16,000 input tokens and num_batch=512 (the default), the model performs 32 forward passes (16,000 ÷ 512). With num_batch=2048, it performs 8 forward passes, 4x fewer iterations.
Why Larger Batches Are Faster
GPU matrix multiplication is most efficient when matrices are large enough to saturate the compute units. A batch of 512 tokens may not fully use the GPU’s parallel capacity, especially on Apple Silicon with its wide SIMD units. A batch of 2048 better saturates the hardware.
Real-World Impact
The improvement isn’t a perfect linear scaling (2048/512 = 4x) because other factors like memory bandwidth and cache effects come into play, but a 2-3x speedup in prompt evaluation from increasing batch size from 512 to 2048 is typical.
Memory Trade-Off
Larger batches require more memory for intermediate activations (the temporary tensors computed during the forward pass). For a model that’s already using 54 GB, the additional memory for 2048-token batches is modest (usually a few hundred MB) but worth monitoring on memory-constrained systems.
Set it in Ollama: OLLAMA_NUM_BATCH=2048
Inference Engines for macOS Apple Silicon
Not all inference engines are equal on Apple Silicon. Here’s a technical comparison.
Ollama
- Backend: llama.cpp compiled with Metal acceleration, wrapped in a Go server
- Strengths: Easiest setup, built-in model management, KV cache reuse between requests, Anthropic/OpenAI-compatible API endpoints, automatic GGUF model downloading
- Limitations: Less control over advanced parameters (no per-layer GPU offloading control, limited quantization options for KV cache beyond what env vars expose)
- Best for: General use, Claude Code integration, getting started quickly
llama.cpp (Direct)
- Backend: The C/C++ engine that powers Ollama, used directly via
llama-serverorllama-cli - Strengths: Full parameter control (every runtime flag exposed), latest features land here first before Ollama adopts them,
llama-serverprovides an OpenAI-compatible API, supports advanced features like speculative decoding and grammar-constrained generation - Limitations: Manual model file management, must compile from source for latest features, no built-in model downloading
- Best for: Power users who want maximum control over inference parameters
MLX / mlx-lm
- Backend: Apple’s own ML framework with native Metal optimization
- Strengths: Designed specifically for Apple Silicon with optimized memory access patterns for unified memory, native quantization support, potentially fastest inference on Mac hardware. Avoids the overhead of llama.cpp’s Metal backend (which is a cross-platform abstraction)
- Limitations: Requires models in MLX format (safetensors with MLX-specific quantization), smaller model ecosystem, no built-in Anthropic-compatible API (needs a proxy)
- Best for: Getting maximum performance from Apple Silicon, especially for prompt evaluation where MLX’s optimized memory access shines
LM Studio
- Backend: Same llama.cpp engine as Ollama, with a GUI wrapper and OpenAI-compatible API server
- Strengths: User-friendly interface, good for experimentation and model comparison, easy API server setup
- Limitations: No fundamental speed advantage over Ollama (same backend), less suited for headless/CLI workflows
- Best for: Users who prefer a visual interface for model management and testing
vLLM
- Backend: Purpose-built for NVIDIA CUDA GPUs with features like PagedAttention, continuous batching, and tensor parallelism
- Strengths: State-of-the-art throughput on NVIDIA hardware, excellent for serving multiple concurrent users
- Critical limitation on Mac: Falls back to CPU-only mode since there’s no CUDA on Apple Silicon. Performance drops to ~1-2 tokens/second, unusable for interactive work
- Best for: NVIDIA GPU servers exclusively. Do not use on Mac.
Comparison Table
| Engine | Backend | Apple Silicon Support | Prompt Eval Speed | Ease of Use | API Compatibility |
|---|---|---|---|---|---|
| Ollama | llama.cpp + Metal | Good | Good | Excellent | Anthropic + OpenAI |
| llama.cpp | Native + Metal | Good | Good | Moderate | OpenAI |
| MLX | Apple Metal native | Best | Best (potential) | Moderate | Needs proxy |
| LM Studio | llama.cpp + Metal | Good | Good | Excellent | OpenAI |
| vLLM | CUDA (CPU fallback) | None (CPU only) | Unusable | Moderate | OpenAI |
Factors That Affect Inference Speed
To summarize all the variables that determine how fast your local LLM runs:
Model factors:
- Model size: Larger models require more memory bandwidth per token. A 79.7B model at Q4_K_M (~54 GB) pushes the limits of 64 GB unified memory
- Quantization level: Lower quantization (Q4 vs Q8 vs FP16) reduces memory and speeds up inference at a quality cost
- Number of layers and attention heads: More layers = more sequential computation; more heads = more attention computation per layer
Configuration factors:
- Context length (num_ctx): Larger context = more KV cache memory + longer prefill
- Batch size (num_batch): Larger batches = faster prompt evaluation (up to hardware limits)
- Flash Attention: Reduces attention memory from O(n²) to O(n), speeds up long-context inference
- KV cache quantization: q8_0 halves cache memory, enabling larger context or more headroom
Hardware factors:
- Memory bandwidth: The primary bottleneck for token generation. Apple M4 Pro: ~273 GB/s
- Unified memory size: Must fit model + KV cache + OS. Running out triggers swap, which kills performance
- GPU compute units: Affects prefill speed (compute-bound). M4 Pro has a capable GPU but can’t match dedicated NVIDIA datacenter GPUs
Workflow factors:
- Number of API round-trips: Each round-trip pays a prefill cost. Agentic workflows (like Claude Code) make many round-trips
- Prompt caching / KV cache reuse: Significantly reduces prefill cost for conversational workloads where the prefix is shared
- Context management: Keeping the active context small (via autocompaction or summarization) reduces prefill time proportionally
Understanding these factors lets you make informed trade-offs. For a 79.7B model on 64 GB Apple Silicon, the optimal configuration is: Q4_K_M model quantization, q8_0 KV cache, Flash Attention enabled, 16–32K context, batch size 2048, and aggressive context management on the client side.
Follow me
If you are new to my posts, I regularly post about AI, LLMs, AWS, EKS, Kubernetes and Cloud computing related topics. Do follow me in LinkedIn and visit my dev.to posts. You can find all my previous blog posts in my blog