Monitoring Claude Code with Apple Containers Instead of Docker
What We’re Building
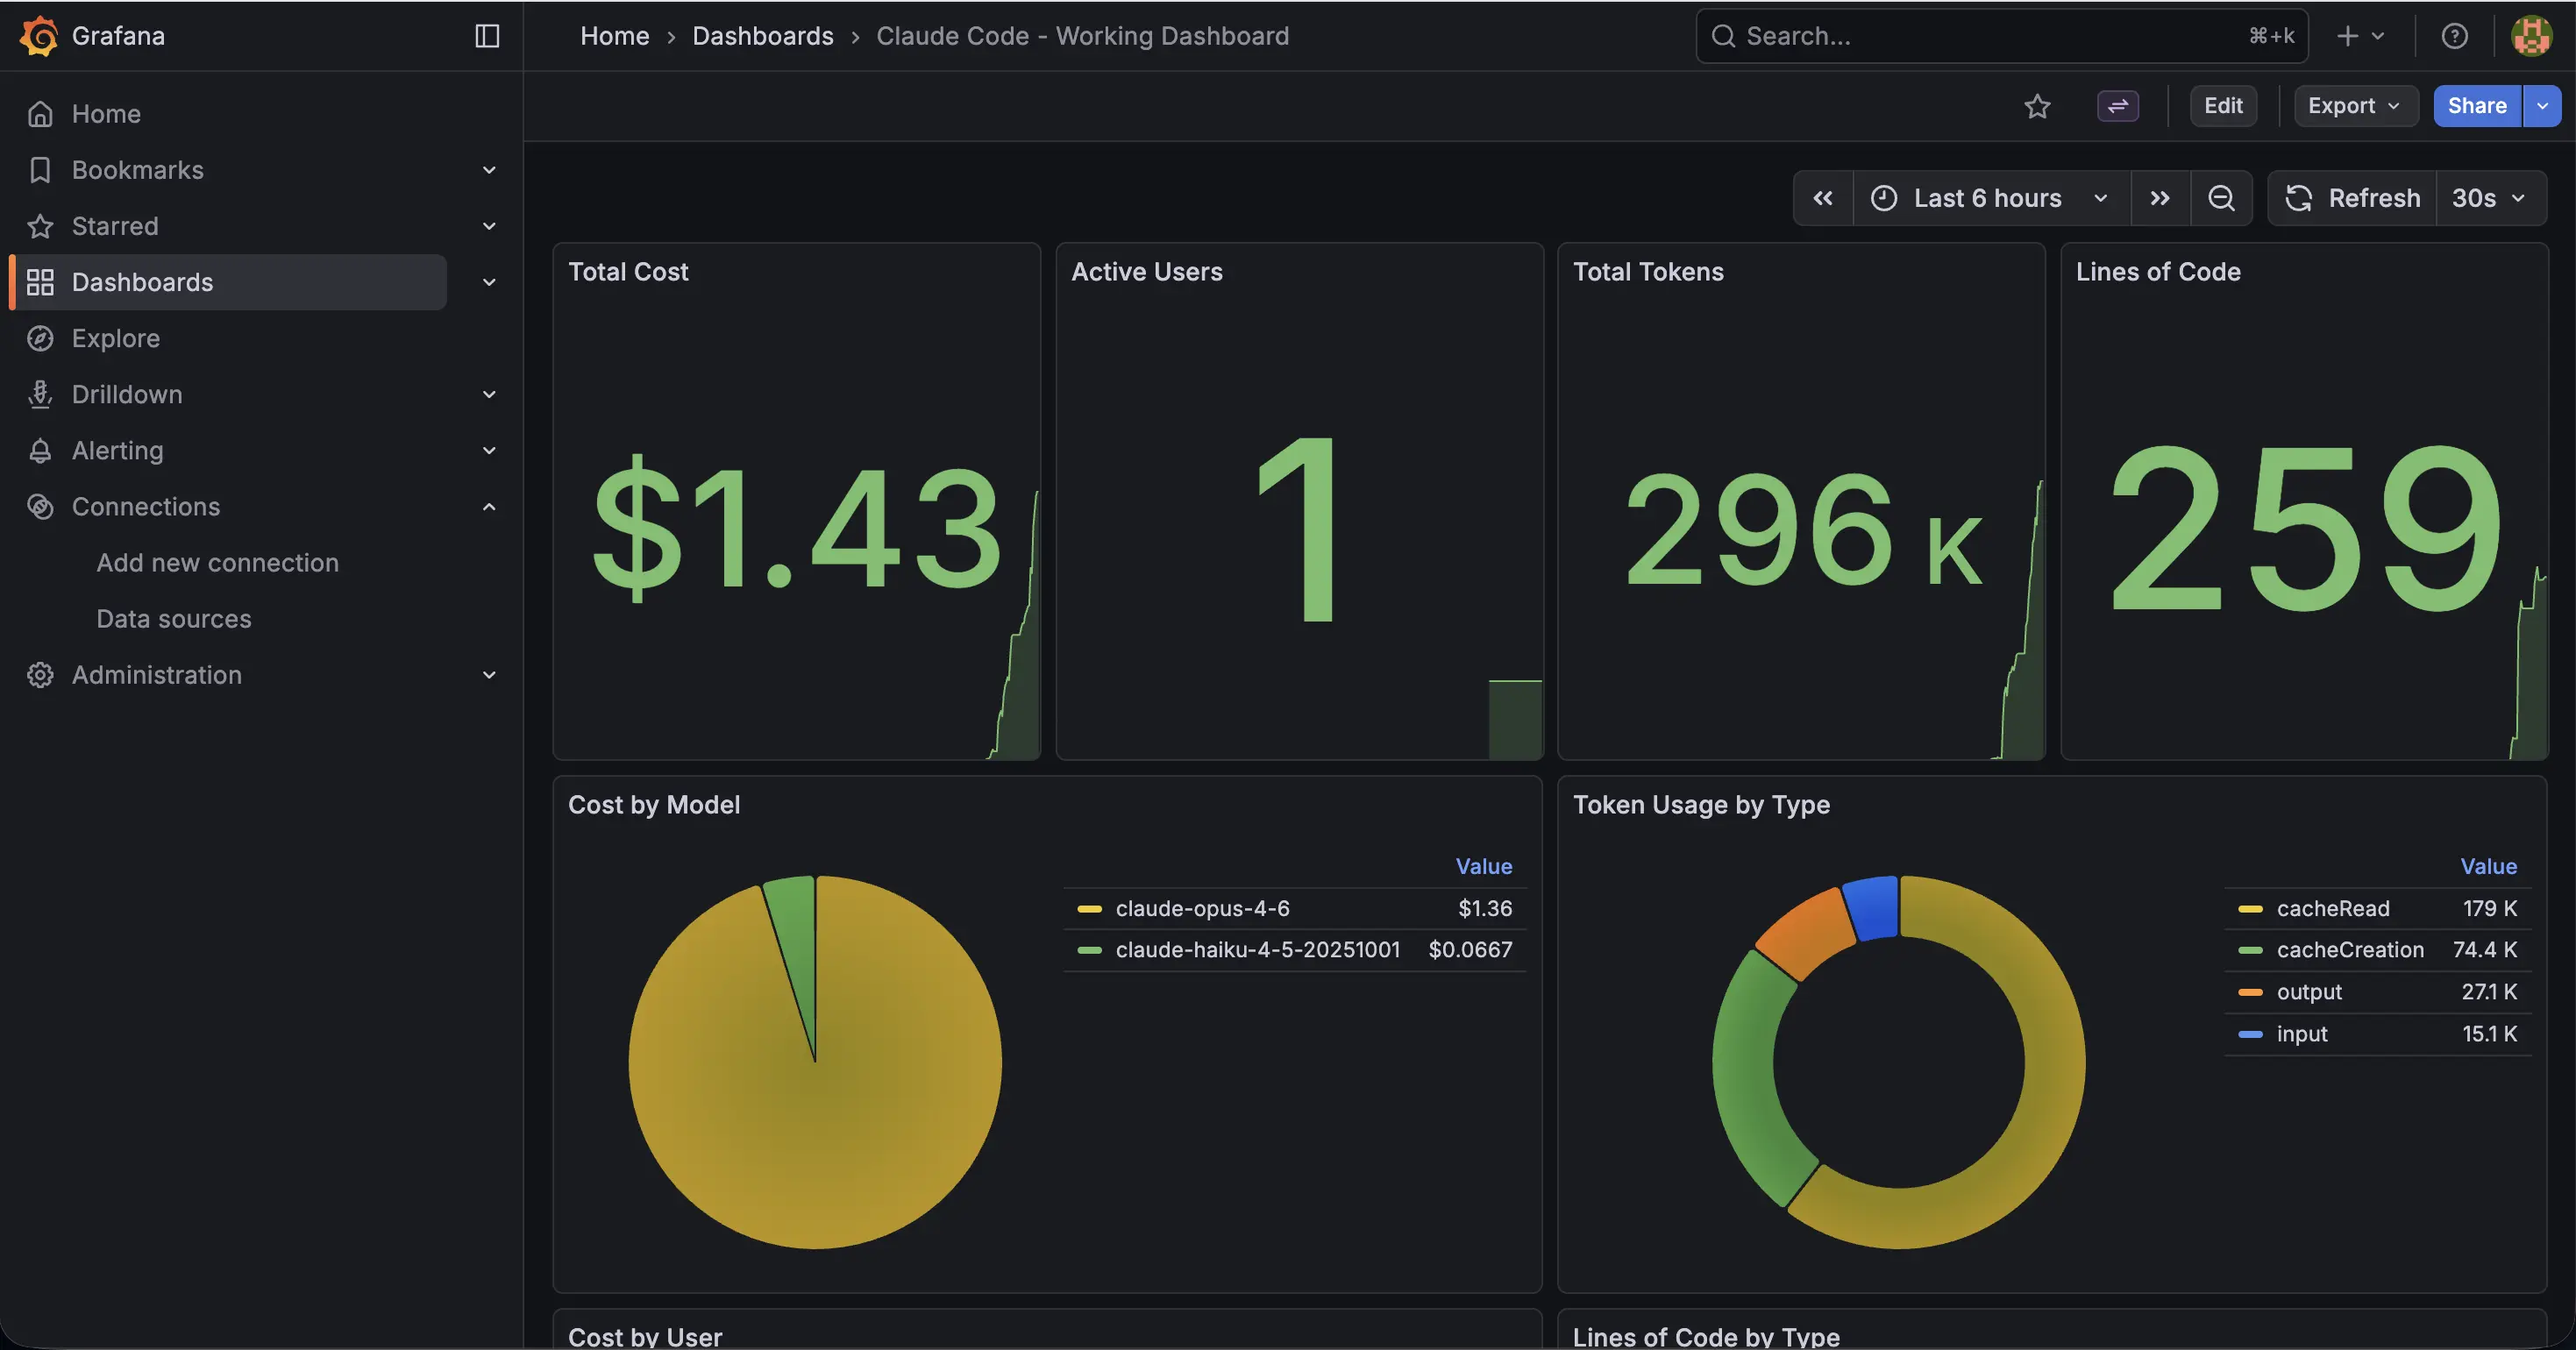
Claude Code emits OpenTelemetry metrics: cost per model, token counts by type, active time, and more. To see what’s happening across sessions, you need somewhere to collect, store, and visualize those metrics.
This post walks through setting up a local monitoring stack on macOS using Apple Containers instead of Docker Desktop. The stack has three services:
- OpenTelemetry Collector receives OTLP metrics from Claude Code and exposes them in Prometheus format
- Prometheus scrapes and stores the metrics
- Grafana visualizes everything via dashboards
By the end, you’ll have a working Grafana dashboard showing cost, token usage, active time, and model breakdowns for your Claude Code sessions.
Why Apple Containers Over Docker
Docker Desktop runs a persistent Linux VM that reserves 2-4 GB of RAM whether your containers are running or not. Apple Containers launches lightweight microVMs on demand with no background daemon. You start them when you need them, and when you stop them, you get the memory back.
Here’s what the monitoring stack actually costs:
| Container | CPU | Memory Limit |
|---|---|---|
| Prometheus | 1 | 256 MB |
| Grafana | 1 | 256 MB |
| OTel Collector | 1 | 128 MB |
| Total | 3 | 640 MB |
Actual memory usage at idle was around 216 MB combined. Compare that to Docker Desktop’s 2-4 GB reserved VM sitting in memory permanently, and the difference is clear.
Prerequisites
You need Apple Containers CLI (container) installed on your Mac. It ships with macOS 26 (Tahoe) or can be installed separately. Verify it’s available:
container --version
You also need Claude Code configured to emit OTLP metrics. Add to your ~/.claude/settings.json:
{
  "env": {
    "OTEL_EXPORTER_OTLP_ENDPOINT": "http://localhost:4318",
    "OTEL_METRICS_ENABLED": "true"
  }
}
Setting Up Config Directories
Apple Containers only supports directory mounts, not individual file mounts. Where Docker lets you do -v ./prometheus.yml:/etc/prometheus/prometheus.yml, Apple Containers requires mounting the parent directory.
Create the config directory structure:
mkdir -p ~/monitoring/container-configs/{prometheus-config,otel-config,grafana-provisioning,grafana-dashboards}
OTel Collector Config
Create ~/monitoring/container-configs/otel-config/otel-collector-config.yaml:
receivers:
  otlp:
    protocols:
      grpc:
        endpoint: 0.0.0.0:4317
      http:
        endpoint: 0.0.0.0:4318

processors:
  batch:
    timeout: 1s
    send_batch_size: 1024
  memory_limiter:
    check_interval: 1s
    limit_mib: 512

exporters:
  prometheus:
    endpoint: "0.0.0.0:8889"
    send_timestamps: true
    metric_expiration: 180m
    enable_open_metrics: true

  debug:
    verbosity: detailed
    sampling_initial: 5
    sampling_thereafter: 200

service:
  pipelines:
    metrics:
      receivers: [otlp]
      processors: [memory_limiter, batch]
      exporters: [prometheus, debug]

  extensions: []

  telemetry:
    logs:
      level: "debug"
Prometheus Config
Create ~/monitoring/container-configs/prometheus-config/prometheus.yml:
global:
  scrape_interval: 15s
  evaluation_interval: 15s

scrape_configs:
  - job_name: 'otel-collector'
    static_configs:
      - targets: ['192.168.64.1:8889']

  - job_name: 'prometheus'
    static_configs:
      - targets: ['localhost:9090']
Note the 192.168.64.1 address. More on that in the networking section below.
Container Run Commands
Each container is started individually with resource limits set via -c (CPUs) and -m (memory). Without these flags, Apple Containers defaults to 4 CPUs and 1 GB RAM per container.
# Prometheus
container run -d --name prometheus \
  -c 1 -m 256m \
  -p 9090:9090 \
  -v ~/monitoring/container-configs/prometheus-config:/etc/prometheus \
  prom/prometheus:latest \
  --config.file=/etc/prometheus/prometheus.yml \
  --storage.tsdb.path=/prometheus \
  --storage.tsdb.retention.time=200h \
  --web.enable-lifecycle

# Grafana
container run -d --name grafana \
  -c 1 -m 256m \
  -p 3000:3000 \
  -e GF_SECURITY_ADMIN_PASSWORD=admin \
  -v ~/monitoring/container-configs/grafana-provisioning:/etc/grafana/provisioning \
  -v ~/monitoring/container-configs/grafana-dashboards:/var/lib/grafana/dashboards \
  grafana/grafana:latest

# OTel Collector
container run -d --name otel-collector \
  -c 1 -m 128m \
  -p 4317:4317 -p 4318:4318 -p 8889:8889 \
  -v ~/monitoring/container-configs/otel-config:/etc/otel \
  otel/opentelemetry-collector-contrib:latest \
  --config=/etc/otel/otel-collector-config.yaml
Configuring Grafana
Adding the Prometheus Datasource
Apple Containers doesn’t provision Grafana datasources automatically. You need to add the Prometheus datasource via the API after Grafana starts:
curl -X POST http://localhost:3000/api/datasources \
  -u admin:admin \
  -H "Content-Type: application/json" \
  -d '{
    "name": "Prometheus",
    "type": "prometheus",
    "url": "http://192.168.64.1:9090",
    "access": "proxy",
    "isDefault": true
  }'
The URL is 192.168.64.1:9090, not localhost:9090. Grafana runs inside its own microVM, so it needs the host gateway IP to reach Prometheus. More on this in the networking section.
The Dashboard UID Problem
When the datasource is created, Grafana assigns it a UID. If your dashboard JSON panels reference a different datasource UID, they will show “No data” even though the metrics exist.
The fix: after creating the datasource, grab its UID from the API response, update your dashboard JSON to use that UID, and import via the dashboards API:
curl -X POST http://localhost:3000/api/dashboards/db \
  -u admin:admin \
  -H "Content-Type: application/json" \
  -d "{\"dashboard\": $(cat ~/monitoring/container-configs/grafana-dashboards/working-dashboard.json), \"overwrite\": true}"
This is tedious to do manually. The convenience script below handles it automatically.
Networking Between Containers
In Docker Compose, containers talk to each other by service name (e.g., otel-collector:8889). Apple Containers runs each container as an isolated microVM with no shared DNS or container network. There is no equivalent of Docker’s bridge network.
Since all three containers publish ports to the host Mac, they reach each other through the host gateway IP: 192.168.64.1.
This is the gateway IP assigned by Apple’s Virtualization framework. It is stable across restarts and standard across macOS. You can verify it from inside any container:
container exec prometheus ip route
In practice, this means:
- Prometheus scrapes OTel Collector at
192.168.64.1:8889(nototel-collector:8889) - Grafana queries Prometheus at
192.168.64.1:9090(notlocalhost:9090) - Claude Code on the host sends metrics to
localhost:4318(this one works because it’s host-to-container, not container-to-container)
The Convenience Script
Managing three containers, a datasource, and a dashboard import by hand gets old fast. Here’s a script that handles everything:
#!/bin/bash
#
# Monitoring stack management script for Apple Containers
# Usage: ./monitoring.sh [start|stop|status]
#

CONFIG_DIR="$HOME/monitoring/container-configs"
DASHBOARD_JSON="$CONFIG_DIR/grafana-dashboards/working-dashboard.json"

start_stack() {
    echo "Starting monitoring stack..."

    # Prometheus
    container run -d --name prometheus \
        -c 1 -m 256m \
        -p 9090:9090 \
        -v "$CONFIG_DIR/prometheus-config:/etc/prometheus" \
        prom/prometheus:latest \
        --config.file=/etc/prometheus/prometheus.yml \
        --storage.tsdb.path=/prometheus \
        --storage.tsdb.retention.time=200h \
        --web.enable-lifecycle

    # Grafana
    container run -d --name grafana \
        -c 1 -m 256m \
        -p 3000:3000 \
        -e GF_SECURITY_ADMIN_PASSWORD=admin \
        -v "$CONFIG_DIR/grafana-provisioning:/etc/grafana/provisioning" \
        -v "$CONFIG_DIR/grafana-dashboards:/var/lib/grafana/dashboards" \
        grafana/grafana:latest

    # OTel Collector
    container run -d --name otel-collector \
        -c 1 -m 128m \
        -p 4317:4317 -p 4318:4318 -p 8889:8889 \
        -v "$CONFIG_DIR/otel-config:/etc/otel" \
        otel/opentelemetry-collector-contrib:latest \
        --config=/etc/otel/otel-collector-config.yaml

    # Wait for Grafana to be ready
    echo "Waiting for Grafana to start..."
    for i in $(seq 1 30); do
        if curl -s -o /dev/null -w "%{http_code}" http://localhost:3000/api/health | grep -q 200; then
            break
        fi
        sleep 1
    done

    # Add Prometheus datasource (ignore error if already exists)
    DS_RESPONSE=$(curl -s -X POST http://localhost:3000/api/datasources \
        -u admin:admin \
        -H "Content-Type: application/json" \
        -d '{
            "name": "Prometheus",
            "type": "prometheus",
            "url": "http://192.168.64.1:9090",
            "access": "proxy",
            "isDefault": true
        }')

    # Get the datasource UID
    DS_UID=$(curl -s http://localhost:3000/api/datasources -u admin:admin \
        | python3 -c "import sys,json; ds=json.load(sys.stdin); print(ds[0]['uid'] if ds else '')")

    if [ -n "$DS_UID" ] && [ -f "$DASHBOARD_JSON" ]; then
        # Update dashboard JSON with correct datasource UID and import
        python3 -c "
import json
with open('$DASHBOARD_JSON') as f:
    dash = json.load(f)
for p in dash.get('panels', []):
    if 'datasource' in p:
        p['datasource']['uid'] = '$DS_UID'
    for t in p.get('targets', []):
        if 'datasource' in t:
            t['datasource']['uid'] = '$DS_UID'
dash['id'] = None
dash['version'] = 0
payload = json.dumps({'dashboard': dash, 'overwrite': True})
import urllib.request, base64
req = urllib.request.Request(
    'http://localhost:3000/api/dashboards/db',
    data=payload.encode(),
    headers={
        'Content-Type': 'application/json',
        'Authorization': 'Basic ' + base64.b64encode(b'admin:admin').decode()
    },
    method='POST'
)
urllib.request.urlopen(req)
"
        echo "Dashboard imported successfully."
    fi

    echo ""
    echo "Monitoring stack is up:"
    echo "  Prometheus:     http://localhost:9090"
    echo "  Grafana:        http://localhost:3000 (admin/admin)"
    echo "  OTel Collector: localhost:4317 (gRPC), localhost:4318 (HTTP)"
}

stop_stack() {
    echo "Stopping monitoring stack..."
    container stop prometheus grafana otel-collector 2>/dev/null
    container rm prometheus grafana otel-collector 2>/dev/null
    echo "Monitoring stack stopped and removed."
}

show_status() {
    container list 2>/dev/null
    echo ""
    for svc in "prometheus:9090/-/healthy" "grafana:3000/api/health" "otel-collector:8889/metrics"; do
        name="${svc%%:*}"
        url="http://localhost:${svc#*:}"
        code=$(curl -s -o /dev/null -w "%{http_code}" "$url" 2>/dev/null)
        if [ "$code" = "200" ]; then
            echo "$name: healthy"
        else
            echo "$name: not responding (HTTP $code)"
        fi
    done
}

case "${1:-}" in
    start)
        start_stack
        ;;
    stop)
        stop_stack
        ;;
    status)
        show_status
        ;;
    *)
        echo "Usage: $0 {start|stop|status}"
        exit 1
        ;;
esac
Save this as monitoring.sh, make it executable with chmod +x monitoring.sh, and use it:
# Start everything (creates containers, configures datasource, imports dashboard)
./monitoring.sh start

# Check health of all services
./monitoring.sh status

# Stop and remove all containers
./monitoring.sh stop
The start command creates all three containers, waits for Grafana to become ready, adds the Prometheus datasource, and imports the dashboard JSON with the correct datasource UID so panels display data immediately.
The stop command removes all containers. No resources are consumed after stopping. These containers do not auto-start after a Mac restart, so you run them only when you need them.
Available Metrics
Once Claude Code is running with OTLP export enabled, you can query these metrics in Grafana or Prometheus directly:
# Total cost by model
claude_code_cost_usage_USD_total

# Token usage by model and type (input, output, cacheRead, cacheCreation)
claude_code_token_usage_tokens_total

# Active time in seconds (cli vs user)
claude_code_active_time_seconds_total
Some useful dashboard panel queries:
# Total cost across all models
sum(claude_code_cost_usage_USD_total)

# Cost breakdown by model
sum by (model) (claude_code_cost_usage_USD_total)

# Total tokens by type
sum by (type) (claude_code_token_usage_tokens_total)

# Cache hit ratio (how much is served from cache vs fresh input)
sum(claude_code_token_usage_tokens_total{type="cacheRead"})
/
sum(claude_code_token_usage_tokens_total{type=~"input|cacheRead|cacheCreation"})
Accessing the Stack
| Service | URL |
|---|---|
| Prometheus | http://localhost:9090 |
| Grafana | http://localhost:3000 (admin/admin) |
| OTel Collector metrics | http://localhost:8889/metrics |
Security Notes
- Change the default Grafana password. The examples above use
admin/adminfor convenience. Change this to a strong password before use, either via theGF_SECURITY_ADMIN_PASSWORDenvironment variable or through the Grafana UI after first login.- All services bind to localhost only. Prometheus (9090), Grafana (3000), and the OTel Collector (4317, 4318, 8889) are exposed on
localhostand are only accessible from your own Mac. They are not reachable from other devices on your network.
Disclaimer
THE SOFTWARE AND INSTRUCTIONS ARE PROVIDED “AS IS”, WITHOUT WARRANTY OF ANY KIND, EXPRESS OR IMPLIED, INCLUDING BUT NOT LIMITED TO THE WARRANTIES OF MERCHANTABILITY, FITNESS FOR A PARTICULAR PURPOSE AND NONINFRINGEMENT. IN NO EVENT SHALL THE AUTHORS BE LIABLE FOR ANY CLAIM, DAMAGES OR OTHER LIABILITY, WHETHER IN AN ACTION OF CONTRACT, TORT OR OTHERWISE, ARISING FROM, OUT OF OR IN CONNECTION WITH THE SOFTWARE OR THE USE OR OTHER DEALINGS IN THE SOFTWARE.
This setup is intended for local development and experimentation only and is not suitable for production use. Use at your own discretion and risk.
Follow me
If you are new to my posts, I regularly post about AI, LLMs, AWS, EKS, Kubernetes and Cloud computing related topics. Do follow me in LinkedIn and visit my dev.to posts. You can find all my previous blog posts in my blog