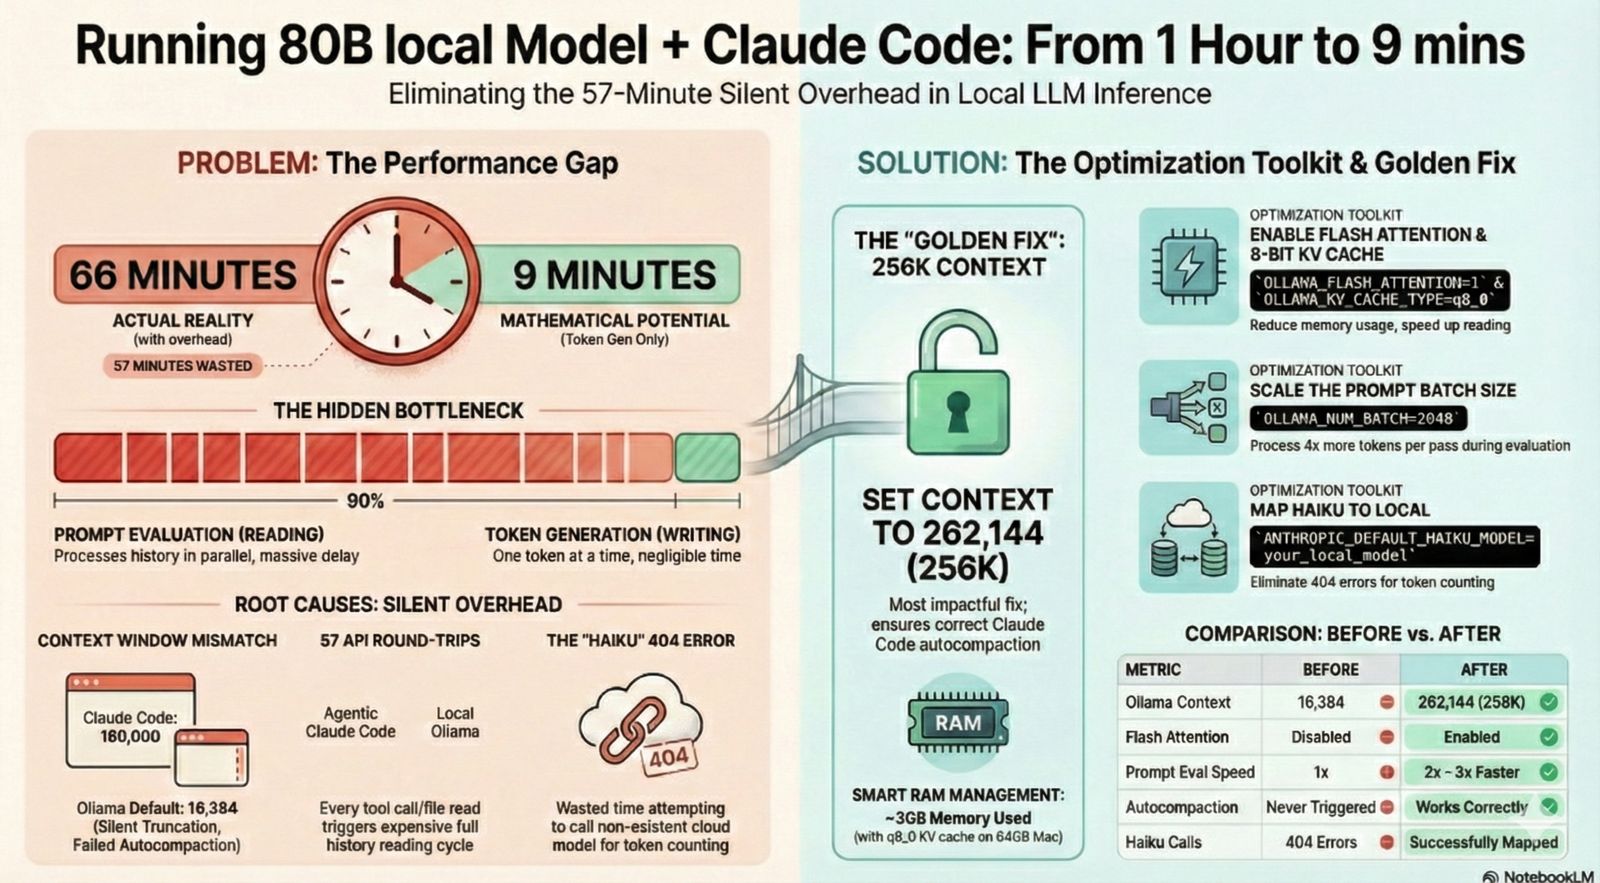
I Ran an 80B Coding Model Locally with Claude Code. It Took 1 Hour Instead of 9 Minutes. Here's What Was Wrong.
The Dream Setup
I finally got Claude Code running with my own local LLM. Everything local, everything private, running on my Mac Mini M4 Pro. No API keys, no cloud costs, no data leaving my network. Just me, my hardware, and a 79.7 billion parameter coding model.
But something was very wrong. A simple task (scaffolding a Django REST API with JWT authentication) took 1 hour.
At 23 tokens per second, the ~13,000 tokens of output should have taken about 9 minutes. Where did the other 51 minutes go?
This post walks through how I diagnosed the problem, what I learned about how LLM inference actually works, and the specific fixes that brought the time down significantly. If you’re running Claude Code with Ollama (or any local LLM), this will save you a lot of frustration.
My Setup
- Hardware: Mac Mini M4 Pro, 64GB unified memory
- Model:
qwen3-coder-next:q4_K_M, a 79.7B parameter coding model, quantized to Q4_K_M (~48 GB on disk, ~54 GB in GPU memory) - Inference server: Ollama, running on the Mac Mini
- Client: Claude Code v2.1.42, connecting to Ollama from another Mac on the local network
- Launch command:
ANTHROPIC_AUTH_TOKEN=ollama \
ANTHROPIC_BASE_URL=http://192.168.10.1:11434 \
ANTHROPIC_API_KEY="" \
claude --model qwen3-coder-next:q4_K_M
Raw benchmarks looked promising. When I tested the model directly via Ollama’s API:
- Token generation: ~23 tokens/second
- Prompt evaluation: ~20 tokens/second
Those numbers aren’t blazing fast, but they’re perfectly usable. So why was the full Claude Code session so painfully slow?
The Problem
The numbers told a clear story:
| Metric | Value |
|---|---|
| Total wall time | ~66 minutes |
| Output tokens | ~13,000 |
| Generation speed | 23 tok/s |
| Expected generation time | ~9 minutes |
| Unexplained overhead | ~57 minutes |
Nearly 90% of the time was spent doing something other than generating tokens. But what?
How I Found the Bottleneck
Claude Code writes debug logs to ~/.claude/debug/. Each session gets its own log file. I opened up the log for my slow session (f519f739-d0f9-41b1-ab4c-a7e01a0e447e.txt, 395 KB of trace data) and started looking at timestamps.
The key was comparing two events for each API call:
- API request sent: when Claude Code sends a request to Ollama
- Stream started: when the first token comes back
The gap between these two timestamps is the prompt evaluation time, the model “reading” all the input before it can start “writing” a response.
Here’s what I found:
| Request | Wait Time | Input Tokens |
|---|---|---|
| First call (cold start) | 77 seconds | 121 |
| Call at 17K tokens | 15 seconds | 17,173 |
| Mid-session | 66 seconds | ~25,000 |
| Late session | 132 seconds | ~30,000 |
| Near the end | 194 seconds | ~34,566 |
The wait times were growing because the input context was growing, and it was growing far beyond what the model could actually handle. More on that in a moment.
With 57 API round-trips in a single session, each one incurring 15–194 seconds of prompt evaluation overhead, the math becomes obvious: most of the hour was spent waiting for the model to re-read the conversation history before generating each response.
Credits: Generated using NotebookLM
Understanding What Happens During Inference
Before getting into the fixes, it helps to understand what happens when a local LLM processes your request. I’ll use analogies here. For the full technical breakdown with formulas and memory calculations, see my companion post: LLM Inference Internals: KV Cache, Flash Attention, and Optimizing for Apple Silicon.
Two Phases: Reading vs Writing
LLM inference has two distinct phases:
Prompt evaluation (prefill): The model reads the entire input (system prompt, conversation history, tool definitions, your latest message). This is like reading an entire book before you can answer a question about it. It processes all tokens in parallel, but it still takes time proportional to how much there is to read.
Token generation (decode): The model writes its response, one token at a time. This is the “thinking and typing” phase. Each new token depends on everything that came before, so it can only produce one at a time.
The generation speed (23 tok/s) is what you see as the response streams in. The prompt evaluation (20 tok/s) happens silently before any text appears. It’s the “thinking pause” before the model starts responding.
The KV Cache: Bookmarks for the Model
When the model reads your input during prompt evaluation, it computes something called the KV cache (Key-Value cache). Think of these as bookmarks. They capture what the model “understood” about each part of the text, so it doesn’t have to re-read everything for every single token it generates.
Without the KV cache, generating a 500-token response would require re-reading the entire input 500 times. With it, the model reads once and then references its bookmarks.
The catch: the KV cache takes memory, and it grows with the length of the conversation. A 16K token context needs significantly less KV cache memory than a 32K token context.
Context Window: The Model’s Reading Capacity
The context window is how much total text the model can consider at once (input and output combined). It’s like the size of the desk the model is working at. Bigger desk means more documents can be open at once, but it also means more memory used.
My model’s native context length is 262K tokens, but Ollama was configured with a 16K context window (num_ctx: 16384). That’s the actual working size.
Flash Attention: Speed-Reading
Flash Attention is an optimization for how the model processes attention (the mechanism that relates different parts of the text to each other). Standard attention requires memory proportional to the square of the sequence length. Flash Attention brings that down to linear by processing the attention in small tiles rather than all at once.
Think of it as the difference between spreading out every page of a book on the floor to compare them all simultaneously (standard attention) versus reading through the book chapter by chapter, keeping only the current chapter in front of you (Flash Attention).
Autocompaction: Summarizing Old Messages
Claude Code has a built-in mechanism called autocompaction. When the conversation gets too long for the context window, it summarizes older messages to free up space. This keeps the conversation going without hitting the context limit.
The trigger point is based on what Claude Code thinks the context window size is. This turns out to be very important, as we’ll see.
Prompt Caching: Reusing the Bookmarks
When Ollama receives a new request where the beginning of the prompt is identical to the previous request (which is typical in a conversation, since the history stays the same and you just add a new message at the end), it can reuse the KV cache from the previous request. Only the new tokens at the end need to be evaluated.
This is a big optimization, but only works if the model stays loaded in memory and the context hasn’t been evicted.
The Five Root Causes
Armed with an understanding of inference, I could now identify exactly what was going wrong.
1. Prompt Evaluation Dominated Every Request
Each of the 57 API round-trips paid a prompt evaluation cost. Even with KV cache reuse, the model had to evaluate the new portion of the prompt each time. As the conversation grew, these costs escalated from 6 seconds to over 3 minutes per request.
Total prompt evaluation time across 57 calls: ~50 minutes out of the 66-minute session.
2. Context Window Mismatch
This was the biggest problem. Claude Code was configured to think the model had a 180,000 token context window (its default assumption for Claude models). The autocompaction threshold was set at 167,000 tokens:
autocompact: tokens=34566 threshold=167000 effectiveWindow=180000
But Ollama’s actual context window was only 16,384 tokens. This meant:
- Claude Code never triggered autocompaction (it thought there was tons of room)
- The conversation context ballooned to 34,566 tokens, more than 2x what Ollama could actually fit
- Ollama was silently truncating or struggling with context that exceeded its window
- Each prompt evaluation was processing far more tokens than necessary
3. Fifty-Seven API Round-Trips
Claude Code is an agentic system. It doesn’t just answer once. It plans, calls tools (file reads, writes, bash commands), observes results, and iterates. For my Django project, this meant 57 separate API calls in one session. Each one triggered a new prompt evaluation cycle.
This is normal behavior for Claude Code, but it means prompt evaluation speed is the dominant factor in session time, not token generation speed.
4. Failed Haiku Calls
After nearly every API call, Claude Code tried to count tokens by calling claude-haiku-4-5-20251001, a cheap, fast model used for token counting in the normal Claude API setup. But this model doesn’t exist in Ollama:
countTokensWithFallback: haiku fallback failed: 404
{"type":"error","error":{"type":"not_found_error",
"message":"model 'claude-haiku-4-5-20251001' not found"}}
Each failed call involved a streaming attempt (404), then a non-streaming fallback (also 404). That’s two wasted HTTP round-trips per token counting attempt, happening dozens of times per session.
5. Streaming 404 Fallback Pattern
For each haiku call, the sequence was:
- Try streaming endpoint → 404
- Fall back to non-streaming endpoint → also 404
- Give up and continue without token count
This wasn’t a big deal on its own, but multiplied across 57+ attempts, it added up to unnecessary network overhead and wasted time.
The Fixes
Ollama Server Optimizations
If you’re running the Ollama Mac app, set these environment variables using launchctl setenv (and create a LaunchAgent plist to make them persist across reboots):
launchctl setenv OLLAMA_FLASH_ATTENTION 1
launchctl setenv OLLAMA_KV_CACHE_TYPE q8_0
launchctl setenv OLLAMA_KEEP_ALIVE 60m
launchctl setenv OLLAMA_NUM_BATCH 2048
If you’re running ollama serve from the command line instead, set them as environment variables:
OLLAMA_FLASH_ATTENTION=1 \
OLLAMA_KV_CACHE_TYPE=q8_0 \
OLLAMA_KEEP_ALIVE=60m \
OLLAMA_NUM_BATCH=2048 \
ollama serve
What each one does:
OLLAMA_FLASH_ATTENTION=1: Enables Flash Attention, reducing attention memory from O(n²) to O(n) and speeding up prompt evaluationOLLAMA_KV_CACHE_TYPE=q8_0: Quantizes the KV cache to 8-bit, cutting KV cache memory roughly in half with minimal quality loss. This frees up room for larger contextOLLAMA_KEEP_ALIVE=60m: Keeps the model loaded in memory for 60 minutes between requests. Prevents expensive cold-start reloads and enables KV cache reuseOLLAMA_NUM_BATCH=2048: Increases the prompt evaluation batch size from the default 512 to 2048. Processes more tokens per forward pass, speeding up prompt eval by roughly 2-3x. Note: this env var is not in the official Ollama docs but is a known undocumented setting that may change in future versions
Also set Context Length to 262144 (256K) in the Ollama app settings (menu bar icon > Settings). This was the single most impactful fix. With 256K context, Claude Code’s default autocompaction threshold (~171K tokens) works correctly without any overrides. RAM usage with qwen3-coder-next at 256K context with q8_0 KV cache settles at ~60 GB on a 64 GB Mac. This is possible because qwen3-coder-next uses a hybrid DeltaNet architecture where only 12 of 48 layers need traditional KV cache, so 256K context uses only ~3 GB of KV cache memory. Then quit and reopen Ollama, and warm the model:
curl http://localhost:11434/api/generate -d '{
  "model": "qwen3-coder-next:q4_K_M",
  "keep_alive": "60m"
}'
Note: Do not specify num_ctx in API calls when the Ollama Mac app GUI already has Context Length configured. Setting it in both places causes the model to fail to load.
Claude Code Client Optimizations
With Ollama context set to 256K, the launch command is straightforward:
ANTHROPIC_AUTH_TOKEN=ollama \
ANTHROPIC_BASE_URL=http://192.168.10.1:11434 \
ANTHROPIC_API_KEY="" \
CLAUDE_CODE_EFFORT_LEVEL=low \
ANTHROPIC_DEFAULT_HAIKU_MODEL=qwen3-coder-next:q4_K_M \
claude --model qwen3-coder-next:q4_K_M
No CLAUDE_AUTOCOMPACT_PCT_OVERRIDE is needed with 256K context. Claude Code’s default autocompaction at ~171K tokens works correctly within the 256K window.
CLAUDE_CODE_EFFORT_LEVEL=low reduces the system prompt size and makes the model less verbose, leaving more of the context window for actual conversation and directly reducing prompt eval time.
ANTHROPIC_DEFAULT_HAIKU_MODEL=qwen3-coder-next:q4_K_M fixes the Haiku 404 errors (root cause #4 above). Claude Code calls claude-haiku-4-5-20251001 for background tasks like token counting. Ollama doesn’t have this model, so every call fails with a 404, wasting two HTTP round-trips each time. Pointing it to the same Qwen model eliminates these errors.
If you can’t use 256K context (smaller machines)
If your machine doesn’t have enough RAM for 256K context, use CLAUDE_AUTOCOMPACT_PCT_OVERRIDE to force earlier compaction. Add it to the launch command above.
Formula: CLAUDE_AUTOCOMPACT_PCT_OVERRIDE = (ollama_num_ctx / 180000) * 100
Ollama num_ctx | CLAUDE_AUTOCOMPACT_PCT_OVERRIDE | Compaction triggers at | q8_0 KV cache (qwen3-coder-next) |
|---|---|---|---|
| 32,768 (32K) | 18 | ~32K tokens | 384 MB |
| 65,536 (64K) | 36 | ~65K tokens | 768 MB |
| 131,072 (128K) | 73 | ~131K tokens | 1.5 GB |
| 262,144 (256K) | not needed (use default) | ~171K tokens | 3.0 GB |
Claude Code hardcodes effectiveWindow=180000 for unknown models. Without the override, it won’t compact until 167K tokens, far beyond what smaller context windows can handle.
A note on auto-compaction with non-Claude models: Compaction may fail with local models at smaller context sizes. The model sometimes responds with tool calls instead of a text summary (GitHub #5778, #18168). If this happens, disable auto-compaction with claude config set -g autoCompactEnabled false (stored in ~/.claude.json) and use /clear to start fresh when you hit the context limit. At 256K context, this was not observed.
Watch out for hallucinated env vars: AI assistants (including the one that helped write this post) commonly suggest env vars that don’t exist in Claude Code. I initially used
ANTHROPIC_MODEL_CONTEXT_LENGTHandCLAUDE_CODE_MAX_TURNS, neither of which are real. Always verify against the official Claude Code settings docs and model configuration docs.
Inference Tools for Apple Silicon
If you’re running local LLMs on a Mac, there are several inference engines to consider:
| Engine | Backend | Apple Silicon Optimized | Best For |
|---|---|---|---|
| Ollama | llama.cpp + Metal | Yes | General use, Claude Code integration |
| llama.cpp | Native + Metal | Yes | Maximum control, latest features |
| MLX / mlx-lm | Apple ML framework | Best (native Metal) | Maximum Apple Silicon performance |
| LM Studio | llama.cpp | Yes | GUI-based experimentation |
| vLLM | CUDA-based | No (CPU fallback) | NVIDIA GPU servers only |
Ollama is the easiest path for Claude Code since it provides the Anthropic-compatible API that Claude Code expects. MLX is potentially the fastest on Apple Silicon (native Metal optimization with better memory access patterns), but requires model conversion and an API proxy.
For a detailed technical breakdown of how these engines work internally (KV cache memory math, Flash Attention algorithms, and Apple Silicon memory architecture), read my companion post: LLM Inference Internals: KV Cache, Flash Attention, and Optimizing for Apple Silicon.
Results and Conclusion
After setting Ollama context to 256K and applying the other optimizations, the slowness was resolved. RAM usage settled at ~60 GB on the 64 GB Mac Mini.
| Metric | Before | After |
|---|---|---|
| Ollama context | 16,384 | 262,144 (256K) |
| Autocompaction | Never triggered (threshold 167K) | Works correctly (threshold ~171K, within 256K window) |
| Context window used | Up to 34K+ (silently truncated) | Managed by autocompaction within 256K |
| Prompt eval per call | 30-194 seconds | Significantly reduced |
| Batch size | 512 (default) | 2048 (~2-3x faster eval) |
| Flash Attention | Off | On |
| KV cache type | fp16 | q8_0 (3 GB for 256K context) |
| RAM usage | N/A | ~60 GB |
The single biggest fix was increasing the Ollama context to 256K. This eliminated the context window mismatch between Claude Code (expects 180K) and Ollama (was set to only 16K). With 256K context, Claude Code’s built-in autocompaction works as designed without any overrides. No compaction failures were observed at 256K.
A 79.7B model running locally at 20 tok/s prompt eval on M4 Pro will always be slower than cloud APIs. Each agentic round-trip takes seconds for prompt evaluation. But the difference between “painfully slow” and “totally usable” comes down to configuration. The model was fine. The wiring between Claude Code and Ollama just needed tuning.
Running local is worth it for privacy and cost. You just need to understand what’s happening under the hood.
Follow me
If you are new to my posts, I regularly post about AI, LLMs, AWS, EKS, Kubernetes and Cloud computing related topics. Do follow me in LinkedIn and visit my dev.to posts. You can find all my previous blog posts in my blog